Demography of Assam
Introduction to Demographics of Assam
Geographical and Historical Context
Assam has diverse ethnic, linguistic, and religious demographic composition due to ;
Historical reasons :
Ahom era: Tai-Ahom migration and assimilation with locals due to political instability in Yunaan and North Myanmar region.
British period: Migration of tea garden labourers from Central & Eastern India.
Post-Partition (1947,1971): Influx from erstwhile East Pakistan (now Bangladesh).
Geographical Reasons :
- Rich fertile land resulted in migration from nearby states.
- Frequent floods have shaped the settlement patterns to a great extent.
Key Demographic Indicators Overview
- Total Population:
- Census 2011 — 3.12 crore.
- Latest projections (2025): ~3.65 crore
- Decadal Growth Rate:
- 2001–2011: 17.07% (slightly below national 17.64%).
- Recent annual growth: ~0.9–0.95% (declining trend).
- Density:
- 2011 — 398 persons/sq km (higher than national 382).
- Recent estimates (2024–2025): ~462–465 persons/sq km.
- Comparison with National Averages: Higher rural share (~84–86%), slightly higher density, similar growth deceleration; unique due to migration and ethnic diversity.
- Total Population:
Size, Growth, and Distribution of Population in Assam
Population Trends
Decadal Growth Rate (2001–2011): 17.07%
Slightly lower than national average (17.64%).
Growth peaked in earlier decades (e.g., 31–35% in 1961–1971); declining trend since.
Population Projection:
2026/2031: Estimated 3.7–4.0 crore (based on trend growth).
Growth is uneven across districts.
Higher growth linked to:
High fertility rates in districts like Dhubri, Barpeta.
Migration (internal & cross-border).
Growth rate declining gradually due to improved literacy and health services.
Density and Spatial Distribution
Average Density (2011): 397 persons/sq km.
High Density Areas:
Brahmaputra Valley (fertile plains).
Kamrup (Metro): ~1,315 persons/sq km. (2011 census)
- 2025 estimate : 1520-1580 persons/km²
Low Density Areas:
Hill districts due to rugged terrain and forests.
Karbi Anglong: ~96 persons/sq km.
Rural–Urban Split:
Rural: ~72%
Urban: ~28% (includes census towns).
District-wise Variations
| Category | District | Key Feature |
|---|---|---|
| Highest Growth | Dhubri | High fertility, migration |
| Moderate Growth | Barpeta | Agrarian economy |
| Industrial Influence | Tinsukia | Oil, coal, tea industries |
| Lowest Density | Karbi Anglong | Hilly terrain |
| Urban Concentration | Kamrup (M) | Capital region |
Urbanization Patterns
Urban Population (2011): ~14%.
Urban growth slower compared to national trend.
Major Urban Centres:
Guwahati (~10 lakh)
Silchar, Dibrugarh, Jorhat
Slum Population:
Concentrated in Guwahati.
Linked to migration, informal employment, housing shortage.
Urbanization driven by:
Administrative importance
Trade, transport, and service sector growth
Age and Sex Composition in Assam
Age Structure
Youth (0–14 years): ~30%
Working Age (15–59 years): ~62%
Elderly (60+ years): ~8%
Dependency Ratio: Moderate, due to large working-age population.
Assam has potential for demographic dividend if supported by:
Skill development
Employment generation
Health and education investment
Sex Ratio
Overall Sex Ratio (2011): 958 females/1000 males
Improved from 935 (2001).
Child Sex Ratio (0–6 years): ~962
Better than national average.
District Variations:
Higher sex ratio in tribal-dominated districts.
Lower in urban and industrial districts.
Gender Disparities
Female Workforce Participation: Lower than males, largely informal and agrarian.
Literacy Gap: Male literacy higher than female, though gap is narrowing.
Social Factors: Early marriage, unpaid care work affect women’s participation.
Government Initiatives:
Beti Bachao Beti Padhao
- Lakhpati Baideo Scheme.
- Nijut Moina Scheme
Focus on education, survival, and empowerment of girl child.
Literacy rates and Education in Assam
Literacy Rates
Overall Literacy (2011): 72.19%
Male: 77.85%
Female: 66.27%
Improvement: NFHS-5 indicates literacy levels nearing ~80% in the 2020s.
Rural–Urban Gap:
Urban literacy significantly higher than rural.
Gender gap persists but is gradually narrowing.
Educational Attainment
School Enrolment:
Gross Enrolment Ratio (GER) high at primary level.
Net Enrolment Ratio (NER) declines at secondary level.
Dropout Rates:
Higher at secondary stage due to poverty, early marriage, migration.
Higher Education:
Major universities: Gauhati University, Tezpur University, Dibrugarh University.
Growth in colleges but quality and access remain uneven.
Disparities
Tribal vs. Non-Tribal:
Lower literacy in hill and tribal districts.
Tea Garden Communities:
Literacy around ~50%, below state average.
Impact of Floods:
School damage, displacement, and learning loss in flood-prone areas.
Government Initiatives
Sarva Shiksha Abhiyan (SSA): Universal elementary education.
Mid-Day Meal Scheme: Improves enrolment and retention.
Assam Government Schemes:
Free education and textbooks
Bicycle and uniform schemes for students
Focus on access, retention, and gender equity.
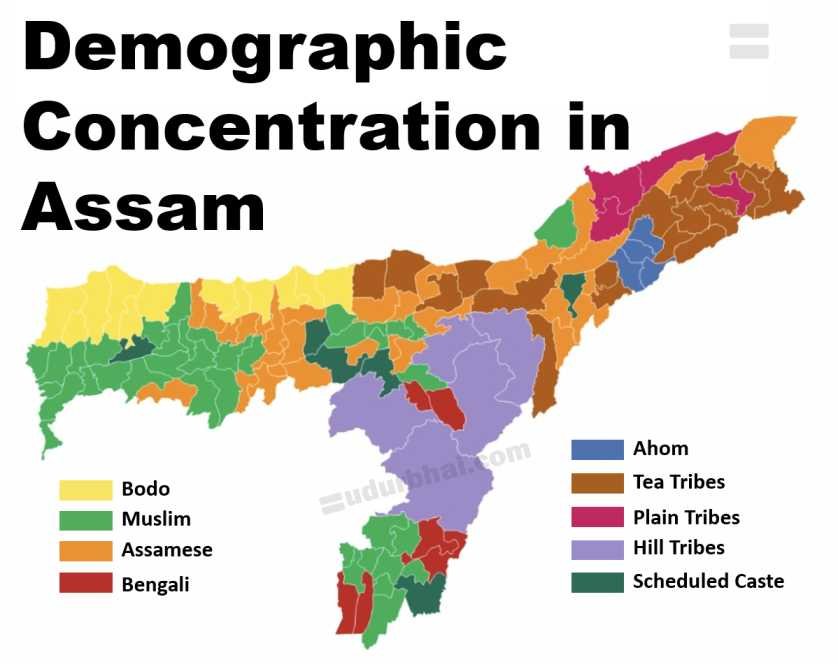
Ethnic and Tribal Demographic Composition in Assam
Ethnic Groups
Assam is ethnically diverse due to historical migration and indigenous communities.
Major communities:
Assamese: ~48%
Bengali: ~28%
Tea Tribes: ~20%
Others: Nepali, Marwari, Bihari, etc.
Major tribes:
Bodo (largest plains tribe)
Mising
Karbi
Dimasa
Ethnic diversity influences culture, language, and politics.
Scheduled Tribes (ST)
ST Population: ~12.4% of total population.
Plains Tribes: Bodo, Mising, Rabha, Sonowal Kachari.
Hill Tribes: Karbi, Dimasa.
Concentrated mainly in BTAD (Bodoland Territorial Areas District) and hill districts.
Presence of Sixth Schedule areas:
Karbi Anglong Autonomous Council
Dima Hasao Autonomous Council
Autonomy demands is linked to identity and development.
Scheduled Castes (SC)
SC Population: ~7.15%.
Major SC communities:
Kaibartta
Namasudra
Hira, Jalkeot
Mostly concentrated in Barak Valley and riverine areas.
Socio-economic challenges:
Lower literacy
Limited land ownership
Dependence on traditional occupations

Linguistic Diversity
Major Languages:
Assamese: ~48%
Bengali: ~28%
Bodo: ~5%
Other languages: Karbi, Dimasa, Hindi, Nepali.
Multilingualism common in border and urban areas.
Language diversity reflected in education, administration, and politics.
Religious Demographic Composition in Assam
Major Religions
Hindus: ~61% (largest religious group)
Muslims: ~34%
Christians: ~3.7%
Others: Buddhists, Sikhs, Jains (small proportions)
Religious diversity shaped by history, migration, and geography.

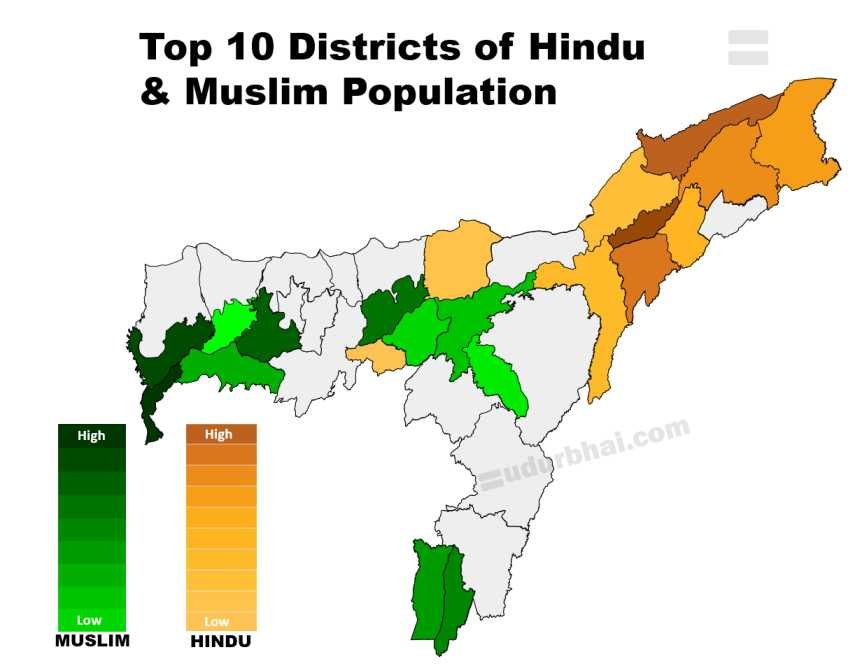
Trends and Distribution
Lower Assam: High Muslim concentration
Dhubri: ~79% Muslim population.
Upper Assam: Predominantly Hindu.
Hill Districts: Rising Christian population, especially among tribal communities.
Urban areas show mixed religious composition.
Socio-Political Implications
Religious composition influences electoral politics and social dynamics.
Communal issues occasionally arise over identity and migration.
Citizenship debates:
NRC and CAA have demographic and political implications.
Emphasis on social harmony and constitutional safeguards.
Migration and Displacement in Assam
Internal and External Migration
External Migration:
Historical in-migration from Bangladesh (often termed “illegal immigration” in policy debates).
Internal Migration:
Out-migration of youth to metros like Delhi, Mumbai, Bengaluru for employment and education.
Migration shaped by economic opportunities, borders, and geography.
Types of Migration
Seasonal Migration:
Flood and erosion-induced displacement from riverine areas (chars, chapories).
Economic Migration:
Tea plantation labourers historically migrated from Jharkhand, Odisha, Chhattisgarh.
Conflict-induced Migration:
Displacement due to ethnic violence, e.g., BTAD-related conflicts.
Impact on Demographics
Changes in ethnic and religious composition in certain districts.
Pressure on land, resources, and public services.
Rapid urban influx, especially into Guwahati, leading to slums and informal settlements.
Policies
Assam Accord (1985):
Fixed 24 March 1971 as cut-off date for detection of foreigners.
National Register of Citizens (NRC), 2019:
Around 19 lakh people excluded.
Migration governance closely linked to identity, citizenship, and federal politics.
Socio-Economic Demographic Indicators in Assam
Employment and Occupation
Workforce Participation Rate: ~38.4%.
Agriculture: Employs ~50% of workforce; largely subsistence-based.
Tea Industry: ~10 lakh workers; major organized sector employer.
Unemployment Rate: ~7–8%, higher among youth and educated sections.
Economy dominated by primary sector, limited industrial diversification.
Poverty and Income
Multidimensional Poverty (NFHS): ~32% population poor.
Per Capita Income: ~₹1.2 lakh
Lower than national average (~₹1.7 lakh).
Poverty higher in rural, flood-prone, and tea garden areas.
Income inequality persists across regions and communities.
Health and Nutrition
Life Expectancy: ~66 years.
Infant Mortality Rate: ~41 per 1000 live births.
Total Fertility Rate: ~1.9 (below replacement level).
NFHS Findings:
High levels of stunting and anemia, especially among women and children.
Health outcomes affected by access gaps and geography.
Housing and Amenities
Electricity Access: ~95%.
Sanitation Coverage: ~70%.
Rural housing vulnerable due to:
Floods and river erosion
Temporary and kutcha structures
Infrastructure uneven across districts.
Challenges and Emerging demographic Issues in Assam
Population Pressure
High population growth in some Muslim-dominated and tribal areas.
Increased pressure on land, water, housing, and public services.
Leads to land fragmentation and livelihood stress, especially in rural Assam.
Aging Population and Health
Rising elderly population due to declining fertility.
Limited geriatric healthcare facilities.
Prevalence of endemic diseases:
Malaria
Japanese Encephalitis
Health challenges aggravated by poor access in remote areas.
Climate and Disaster Impact
Floods displace ~5 lakh people annually.
Riverbank erosion causes permanent loss of land and settlements.
Recurrent displacement alters population distribution and livelihoods.
Inequalities
Regional: Development gap between Upper and Lower Assam.
Gender: Lower female workforce participation and income.
Caste & Community: SCs, STs, tea garden communities remain vulnerable.
Uneven access to education, health, and employment.
Future Projections
Population likely to stabilize by around 2041.
Urbanization: Expected to reach ~20% by 2031.
Policy focus needed on:
Sustainable urban planning
Human capital development
Climate resilience
Government Policies and Initiatives in Assam for Population Control
Two-child norm: Incentive/disqualification policy for local elections and government jobs.
Family Planning Programs:
Contraceptive distribution
Awareness campaigns in rural areas
Focus on maternal and child health
Sources of Data
- Census of India (2011) – for official baseline.
- PLFS – for recent economic insights.
- National Family Health Survey (NFHS-5: 2019–21 — for recent health, fertility, nutrition insights).
- Assam Human Development Report (socio-economic trends).
- Economic Survey of Assam / Directorate of Economics & Statistics (annual projections, state-specific data).
- Other: NITI Aayog reports, UIDAI/Aadhaar estimates, Ministry of Health projections.
Let us know any further suggestions ,we at sudurbhai.com will be happy to hear from you in our comment section below !
